Let's talk money
We're here to open up the financial conversation — helping you grow, track, manage, and save, all from one place.
Try Origin for Free(opens in new window)


Your money, in one place
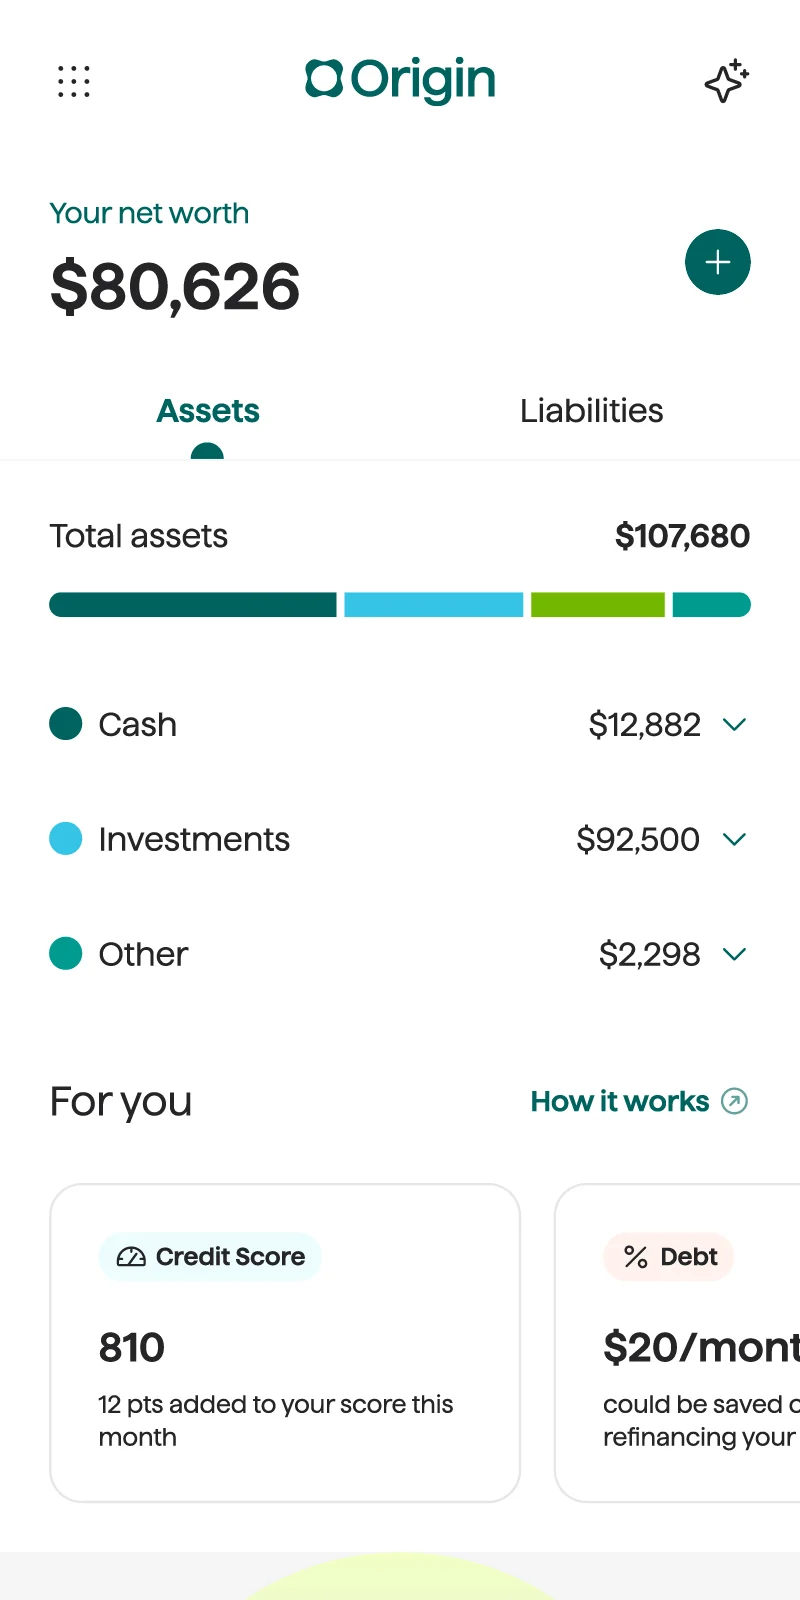
Holistic net worth tracking
Origin gives you the full picture of where money's coming in and where it's going out — so you can navigate with clarity and confidence.
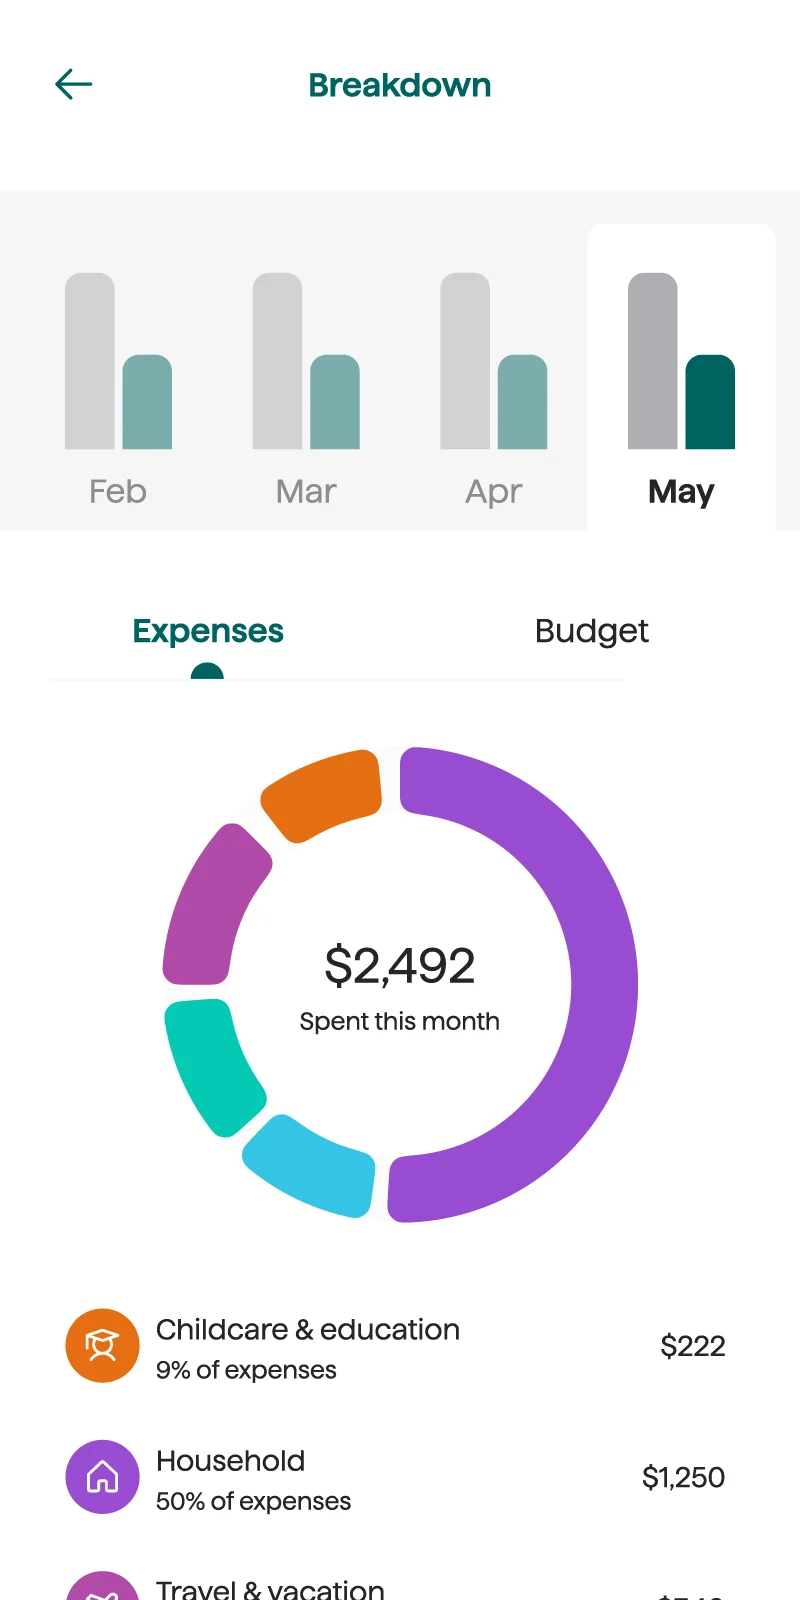
Smart recommendations to help you hit your goals
Origin automatically reviews and evaluates transactions to give actionable recommendations for budgeting and saving.
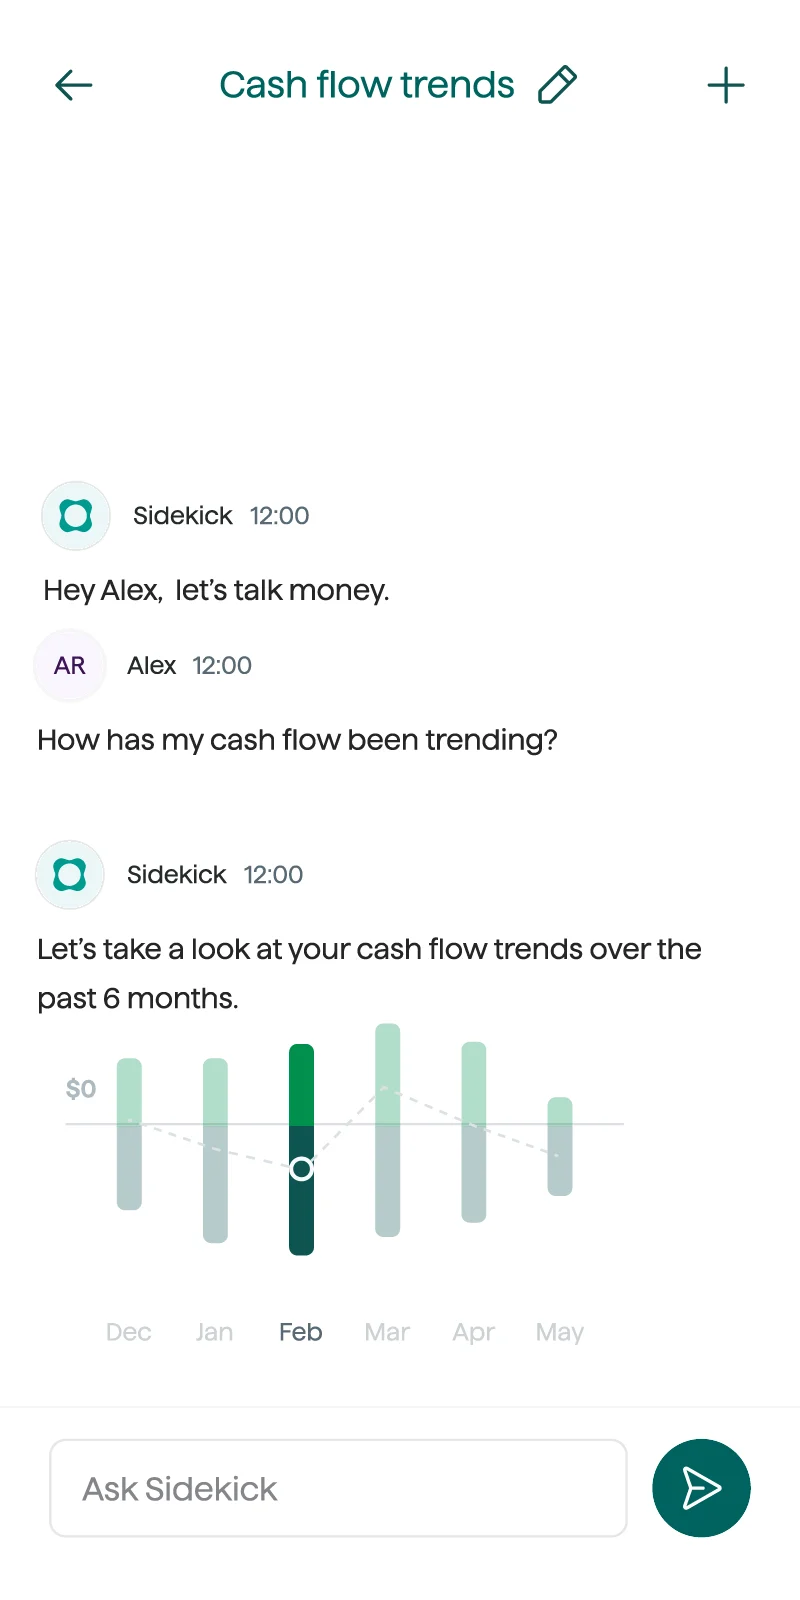
Guidance built around you
Get real-time answers to money questions with Sidekick, your AI-powered planner, or in-depth financial planning support from our Certified Financial Planners™.
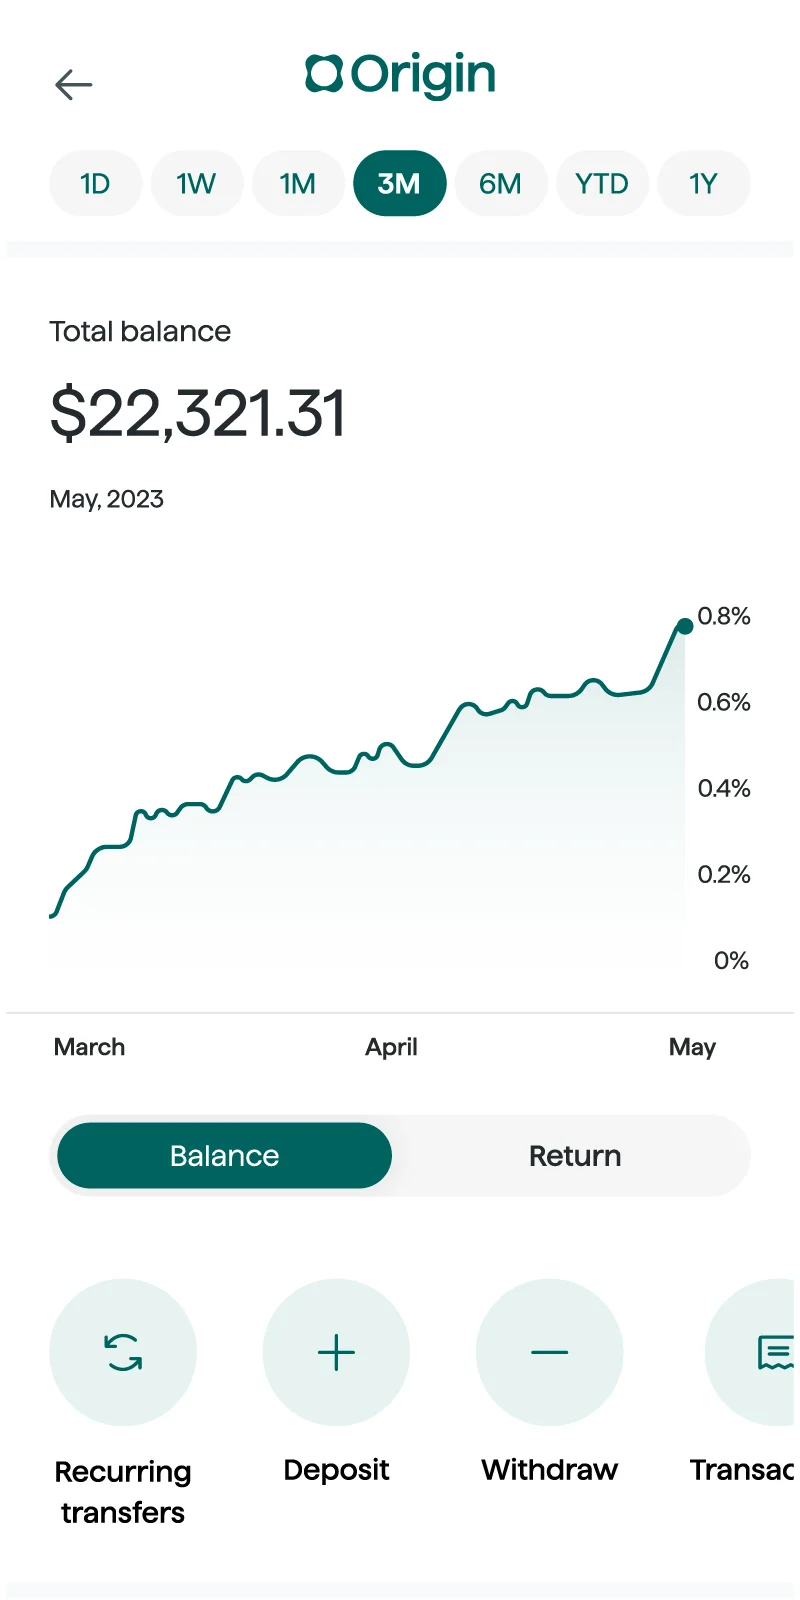
Put your money to work
Origin Invest offers automated investing with no advisory fees.
You don't have to solve money questions solo. With Origin, you'll have a trusted partner to help you through your financial journey.
Learn More
Paying off
student debt

Planning for
retirement

Budgeting
for vacation

Saving
for kids'
college

Starting a
small business

Buying a
new car

Buying a
new home
Get the full picture of your finances
24/7 financial guidance, tax assistance, budgeting and savings tools, and automated, fee-free investing — all in one place, for just $12.99/month.
Origin is the one-stop-shop for money management
Financial planning
Investing
Budgeting
Tax
Estate planning
The current market is fragmented and expensive
Financial Planning
Investing
Budgeting
Tax
Estate Planning
Vacations, budgets, credit card debt, student loans — they're all part of the conversation. Talk money to us. Try free for one month, then $12.99/month.
Get Started for Free(opens in new window)